Generate data reports
 Updated
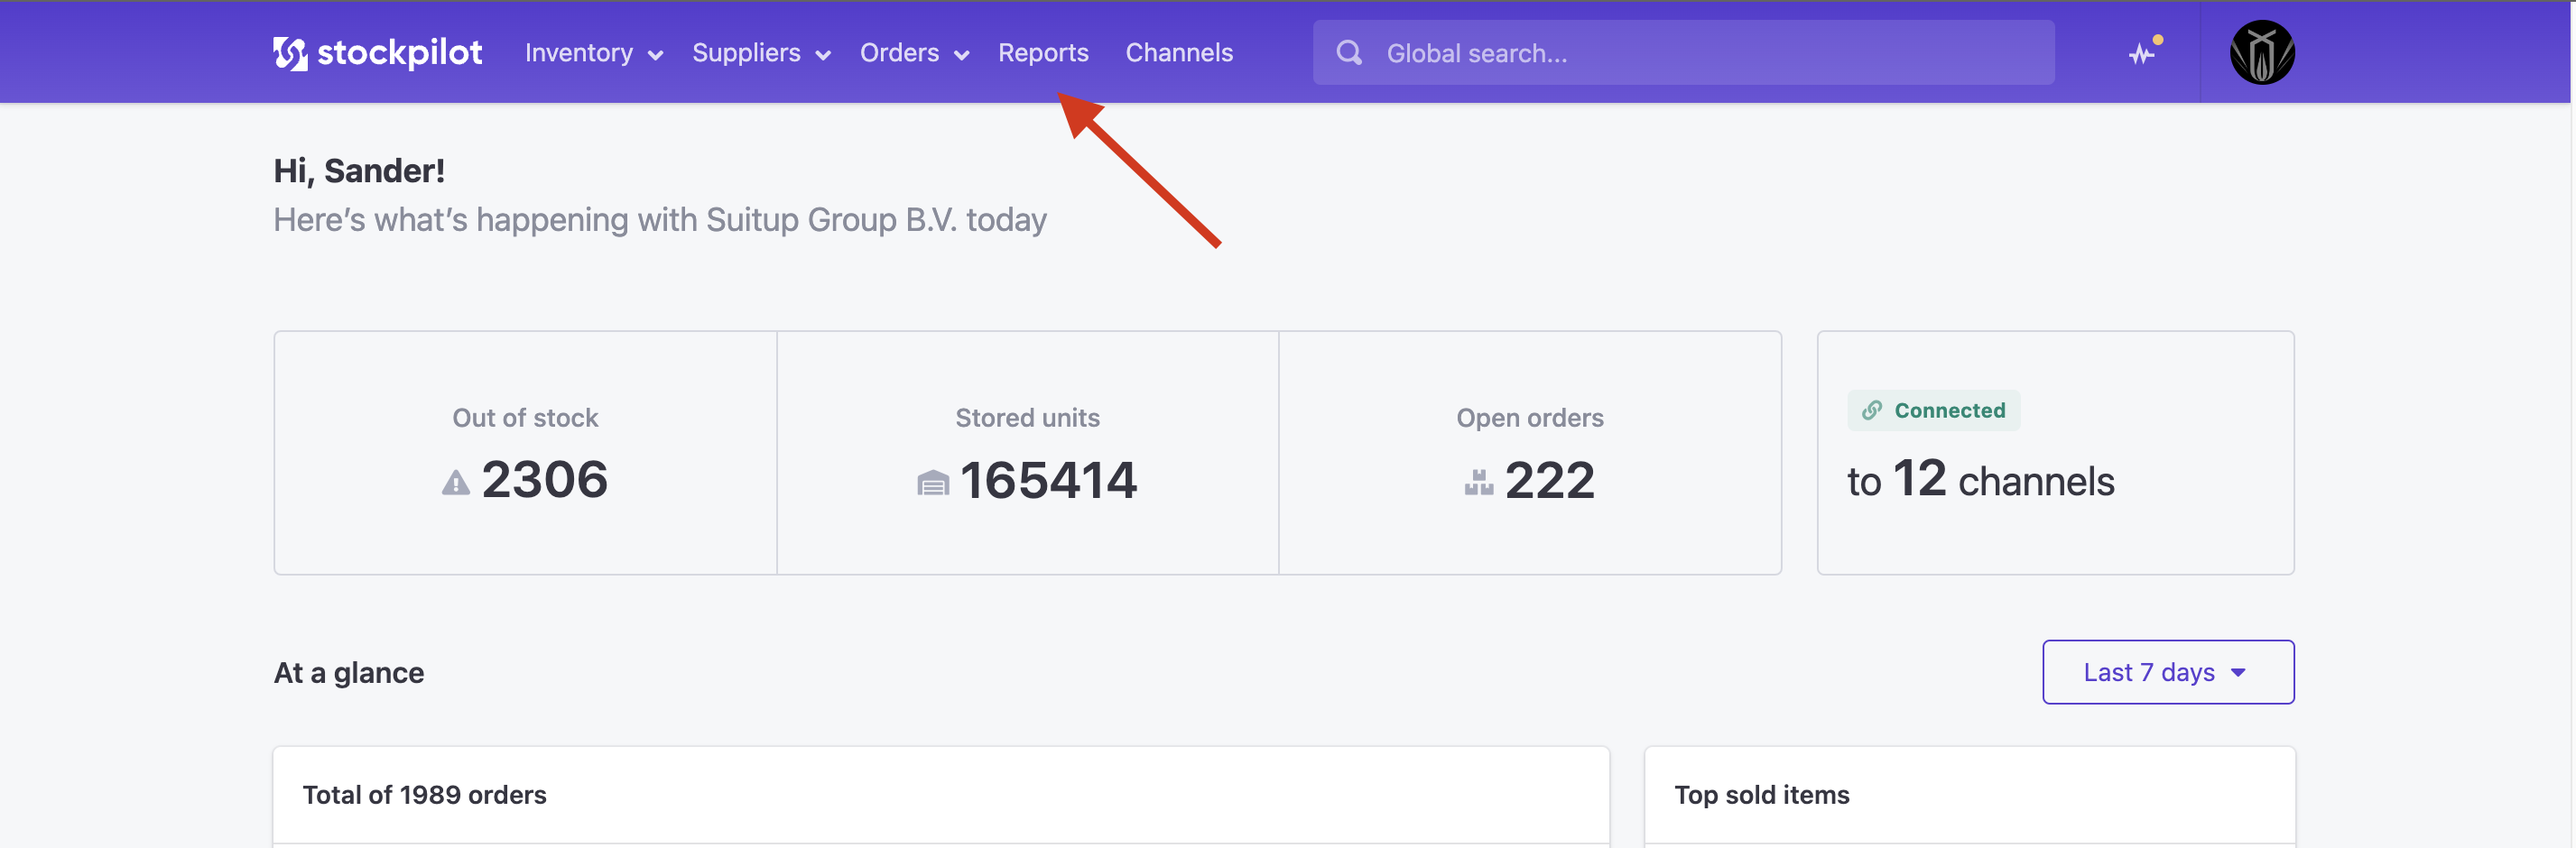
In this article I will show you how to generate different kind of data reports. To start navigate to Reports in the top menubar.
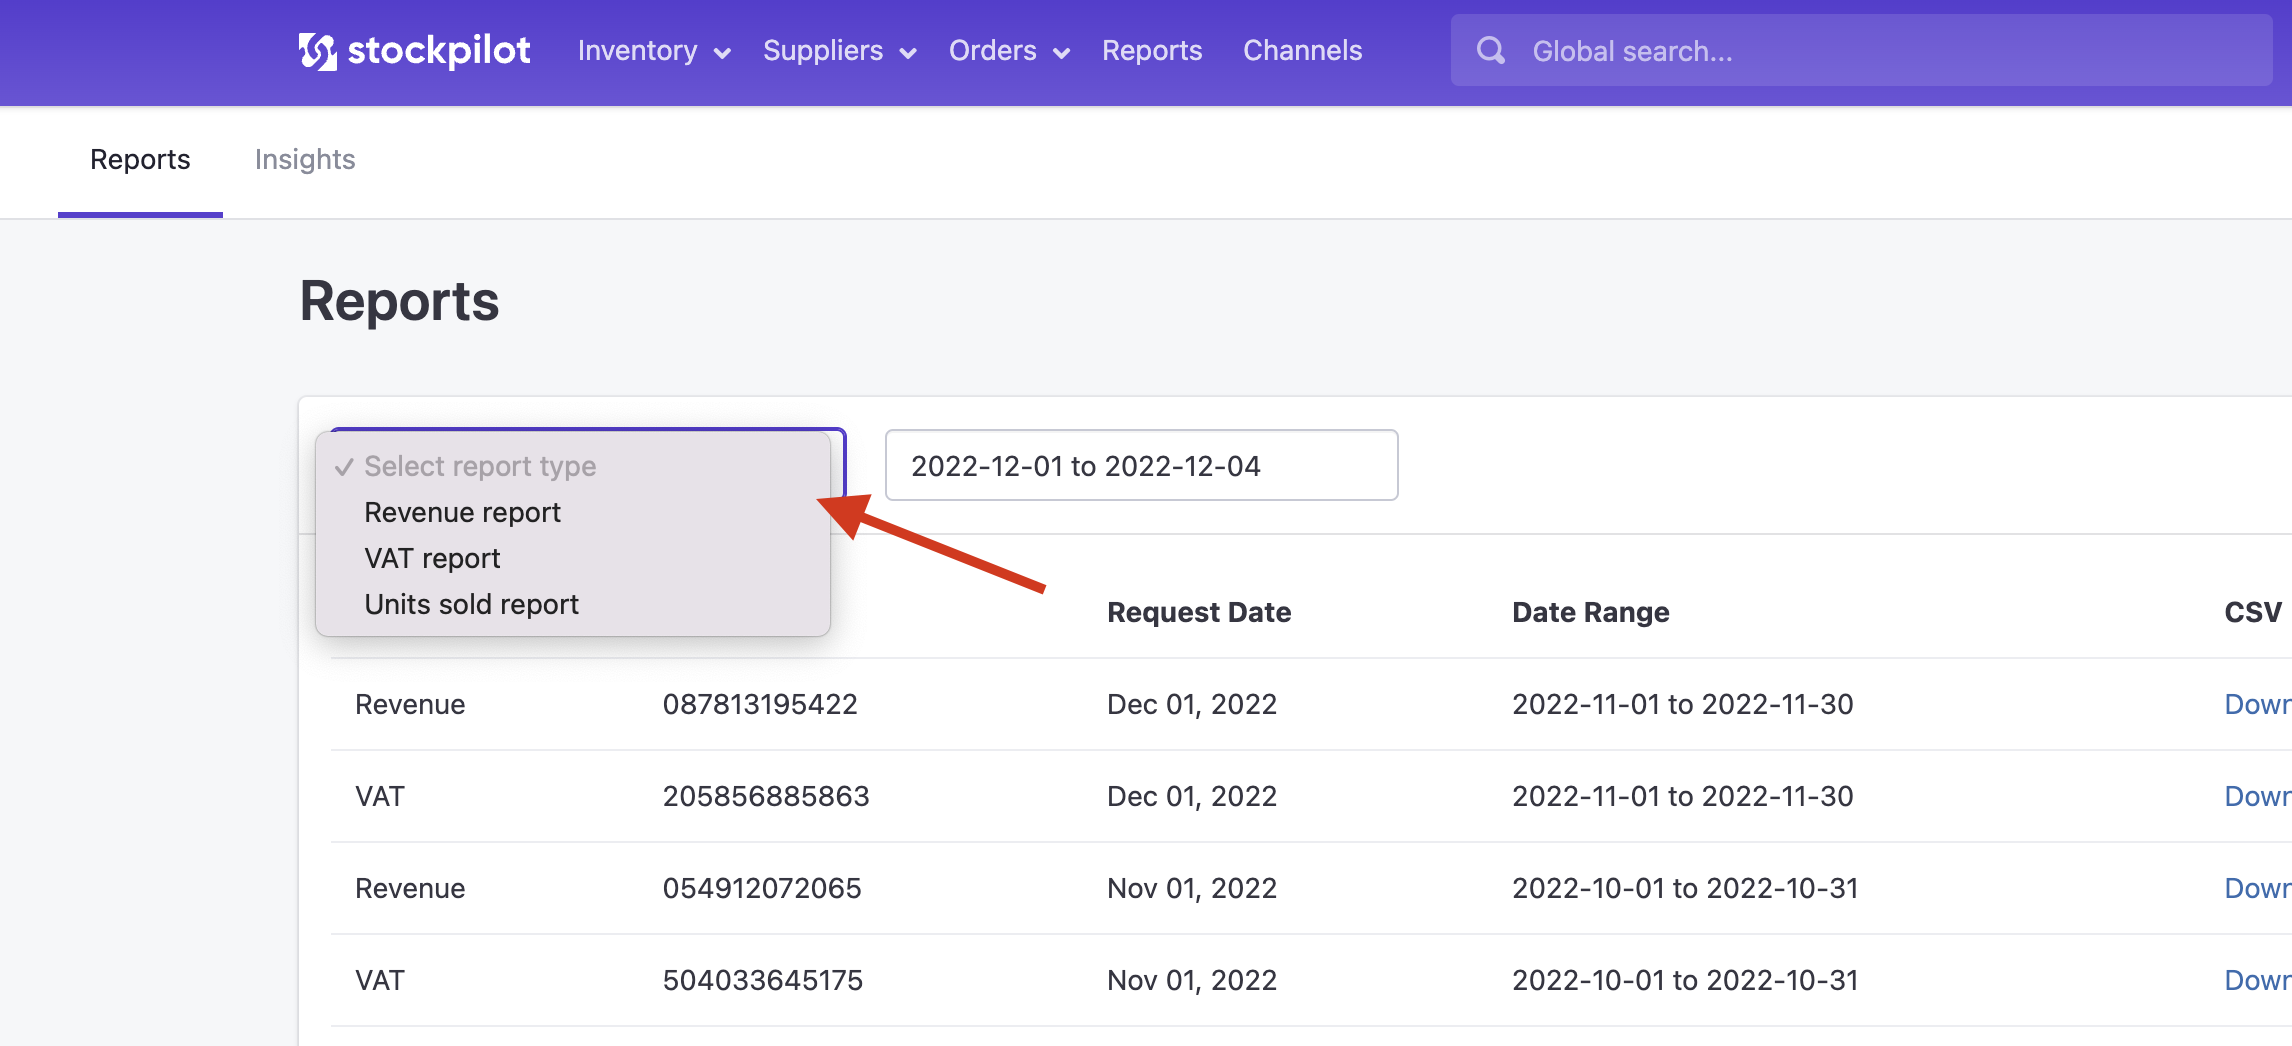
Next you see a dropdown where you can select your report of choice.
We will go through every type of report later in this article, but first let's see how to generate one.
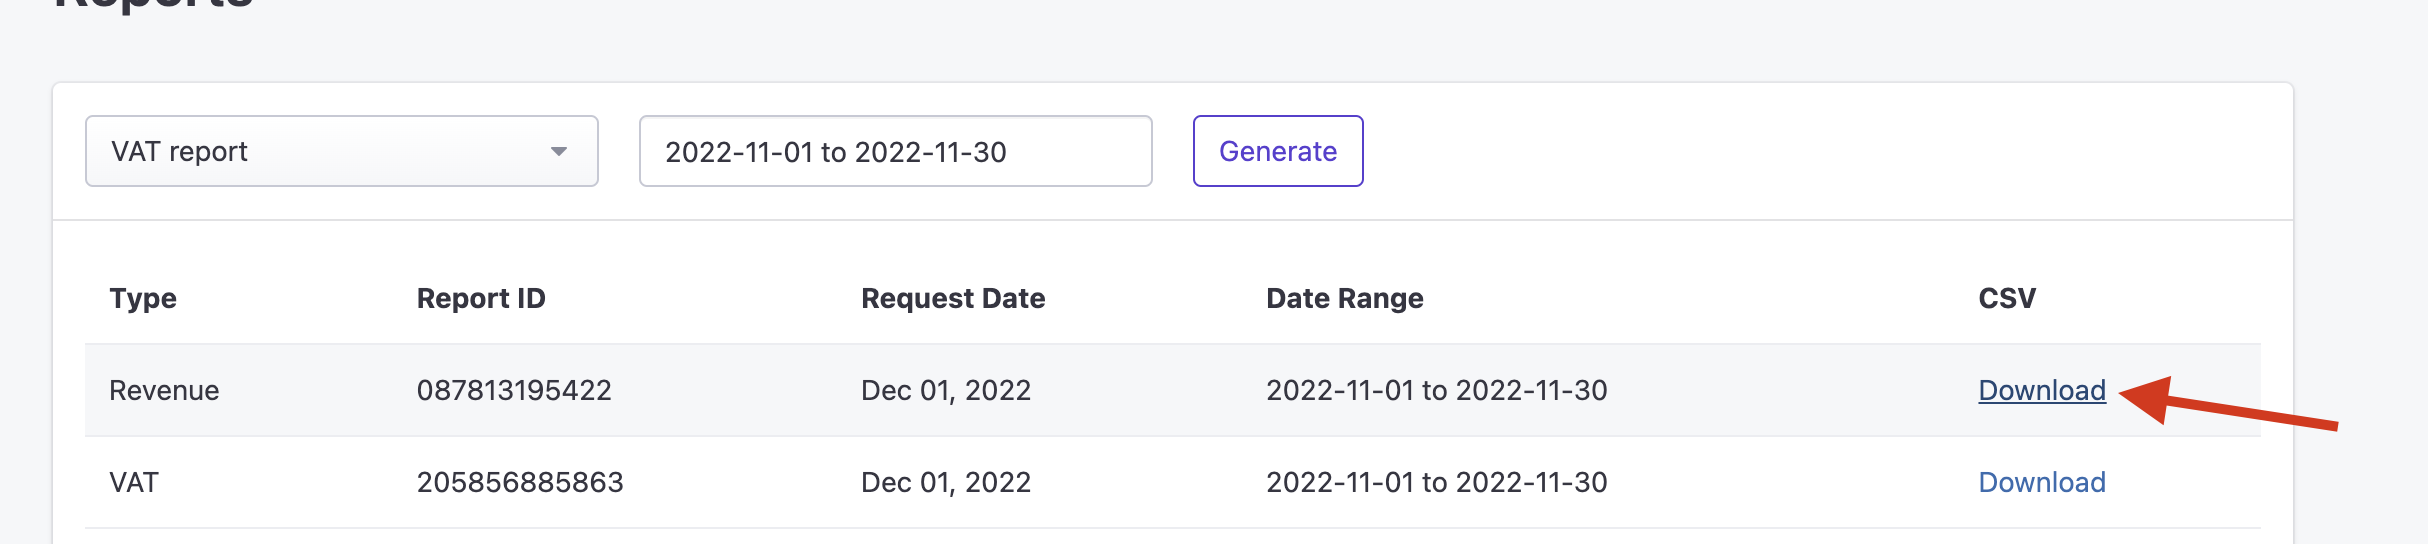
- Select a report type
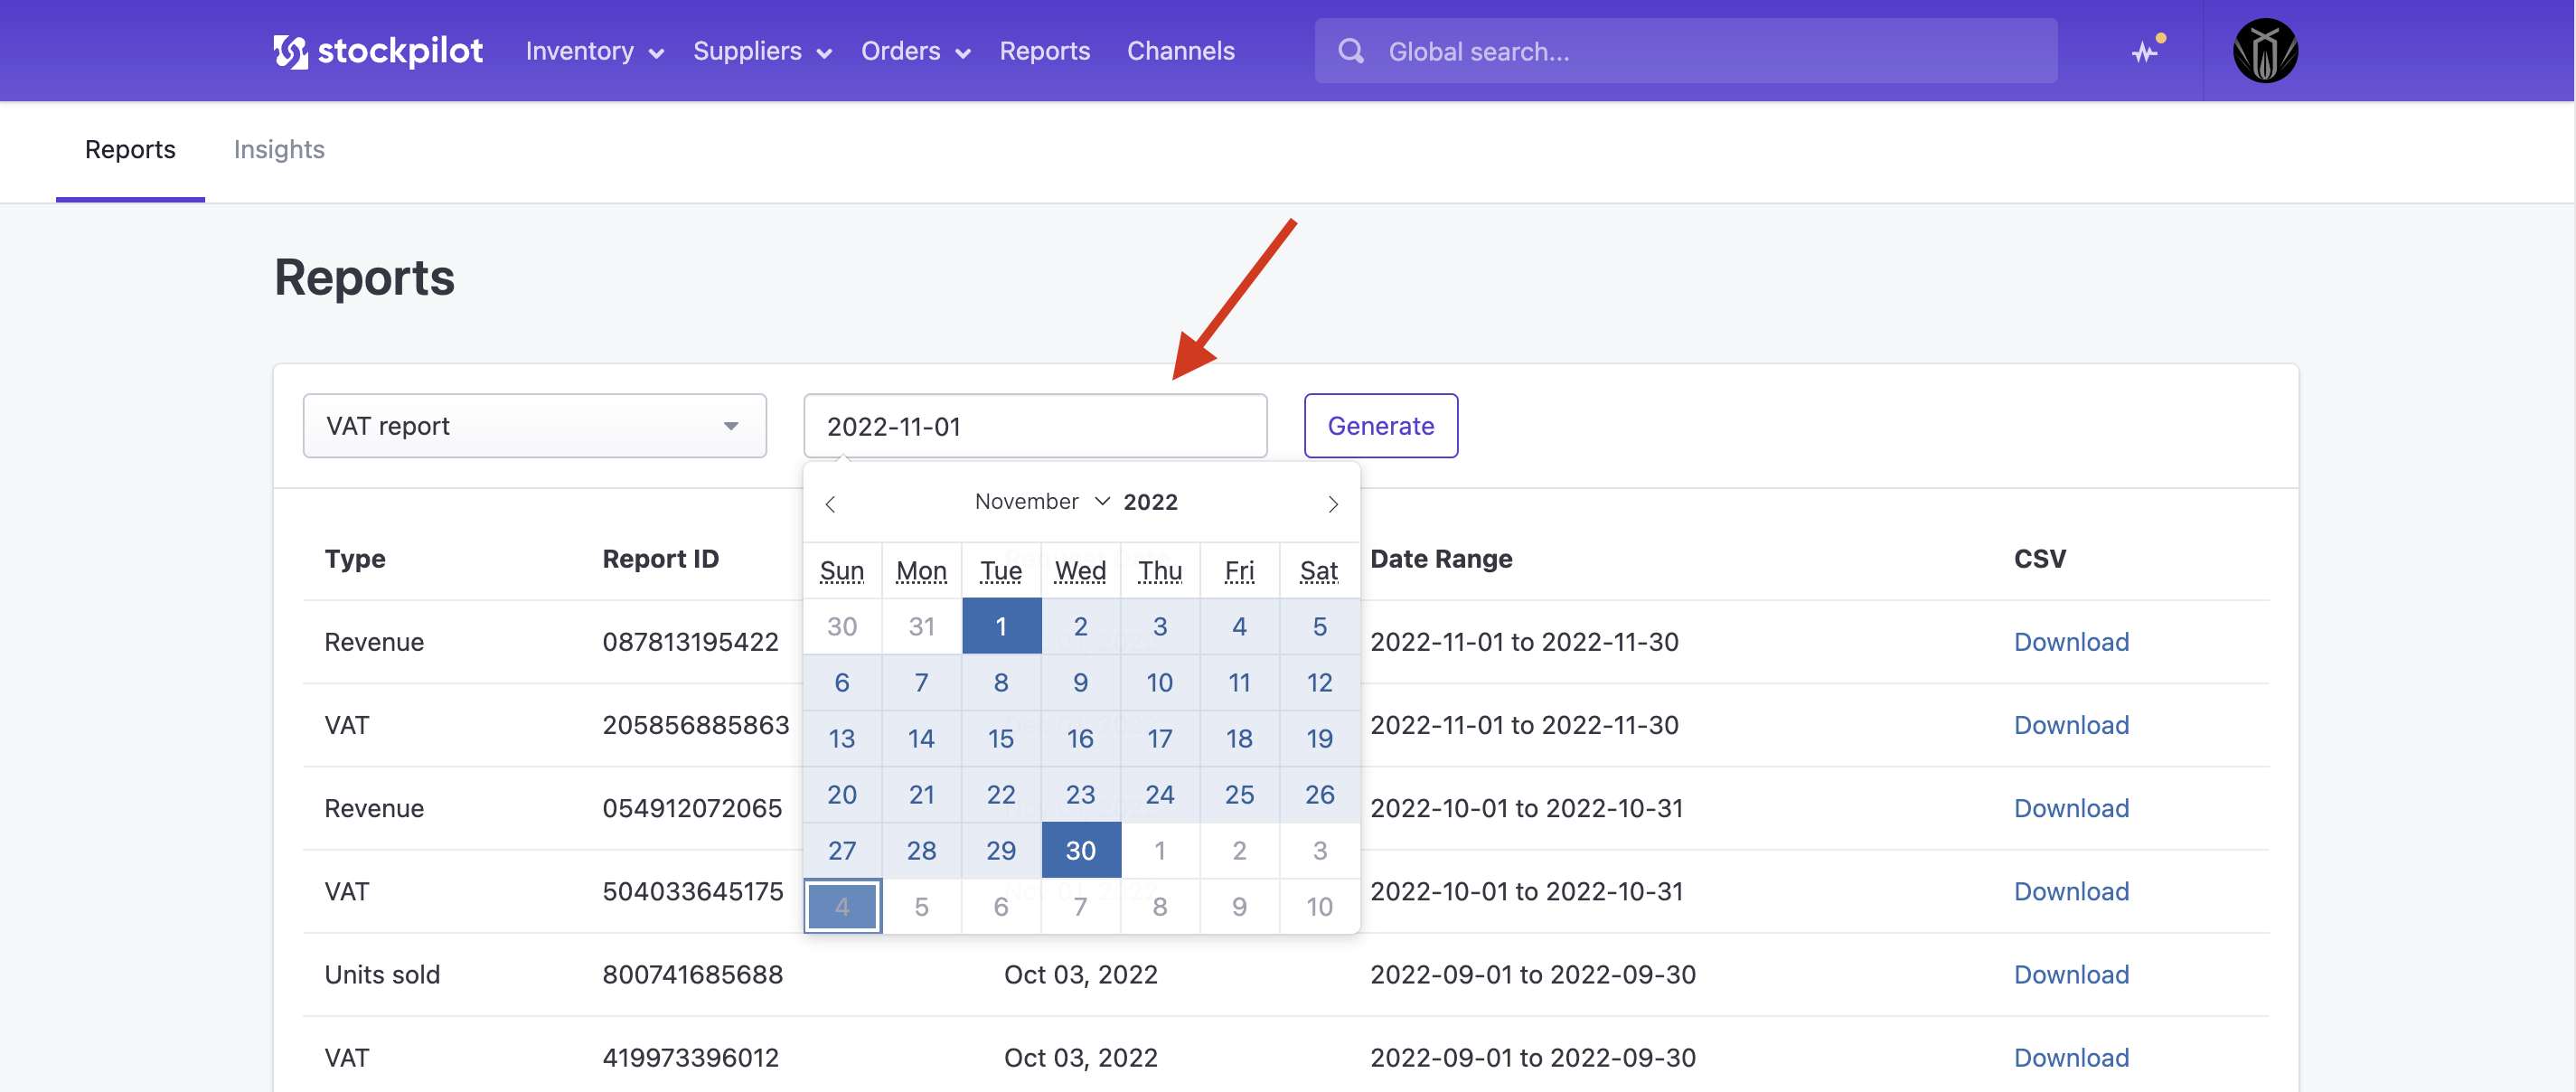
- Select a date range
- And finally hit the Generate button
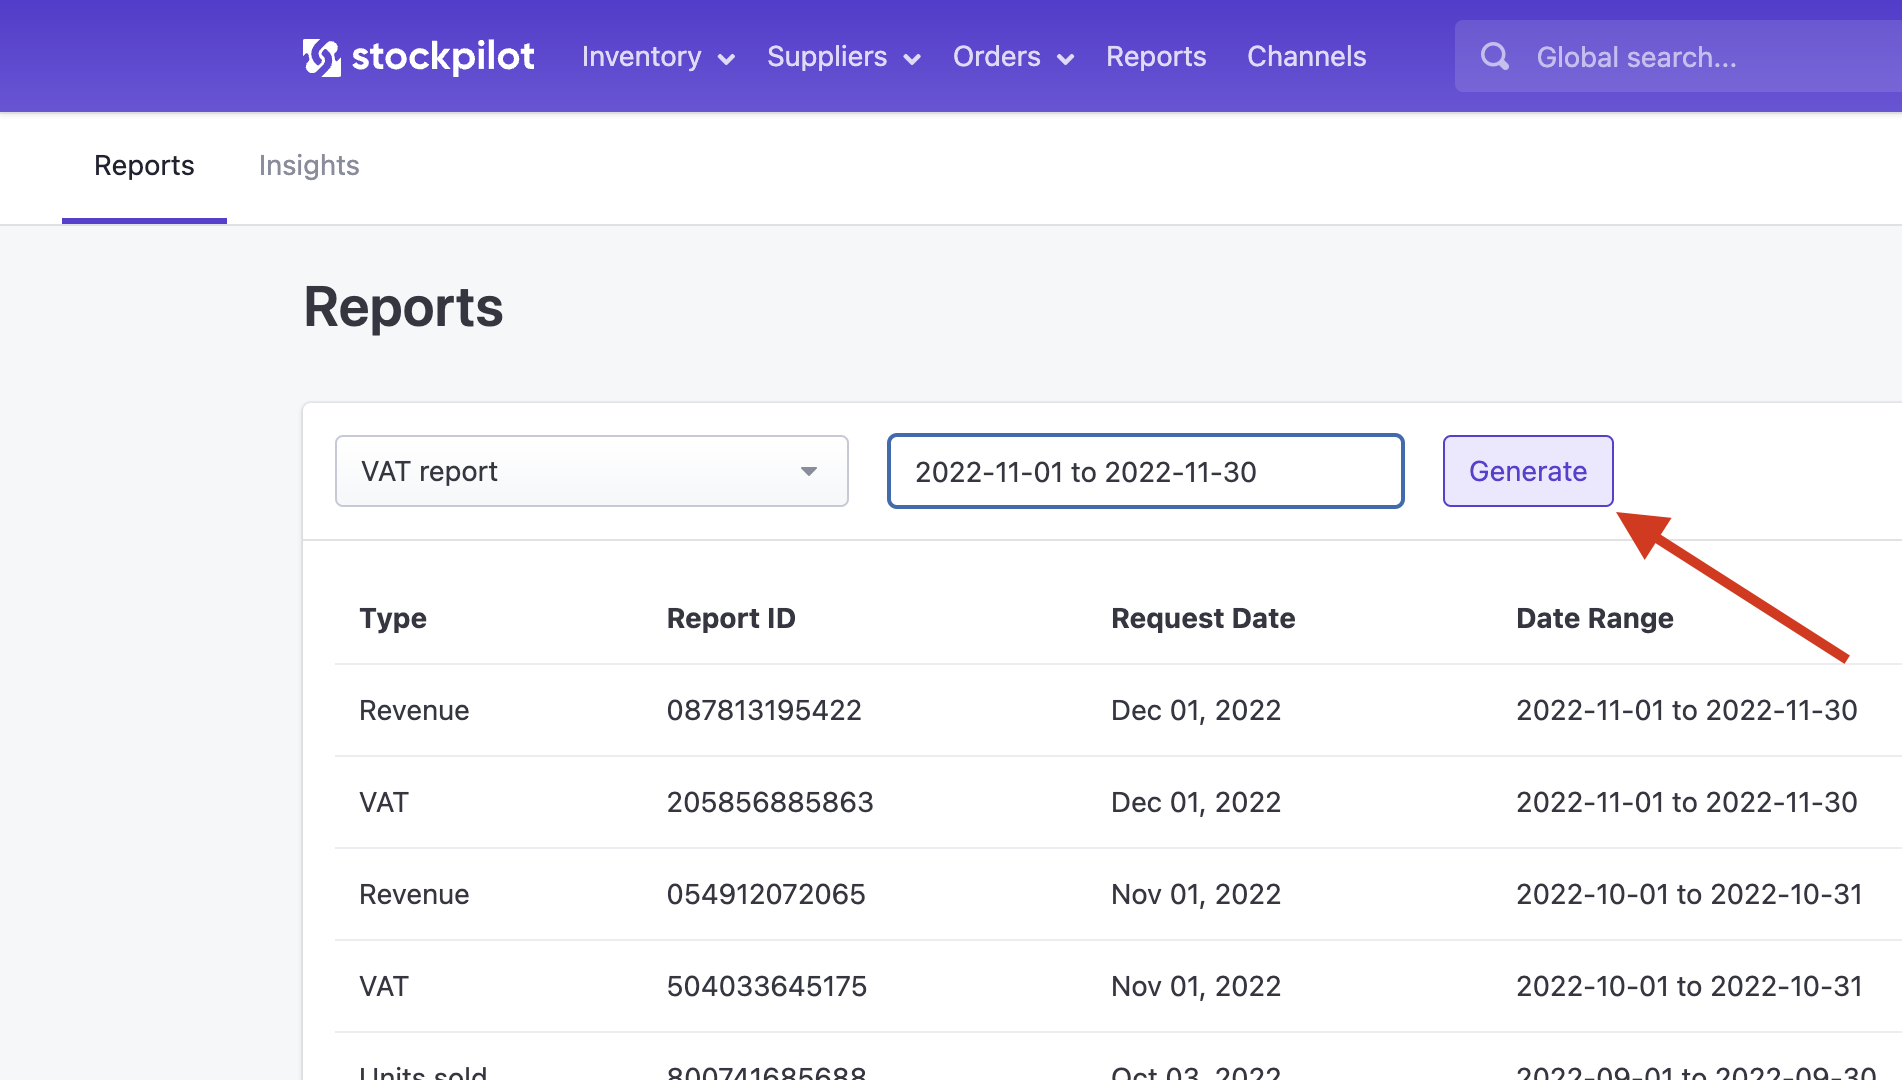
The report will now be generated and once that is done, it will appear in the table below, where you can download the CSV data file on the right.
Note that the data shown in the data reports are based on sales and connections to sales channels, so make sure your listings are connected properly. For more information about connecting the listings go to this section of the knowledge base.
Revenue report
The revenue report is a collection of all revenue for a specified date range, chopped up per category, channel and sales country.
This report type consists of four columns, that are named: country, category, channel, revenue.
In the first column you will see the country where the revenue is generated, the second the category to which the revenue belongs, the third is the channel where this revenue is coming from and the last one is the revenue amount.
VAT report
The VAT report is a collection of orders from which Stockpilot was able to register a VAT number in a specified date range.
This report type has seven columns, with the names: country, channel, order no., vat no., revenue, currency, exchange rate.
The first column is the sales country for the specific order. The second column is the channel where the order was placed. The third is the order number, the fourth column is the VAT number that Stockpilot registered and the fifth column is the currency in which this order was paid and the last column is the exchange rate toward your localized currency on the moment the order was placed.
Units sold report
The units sold report is a collection of the units that are sold per categorie in a specified date range.
This report type has four column, with the names: category, quantity, purchase, retail.
The first column is the category of the units. The second column the quantity sold in this specific category. The third column is the total purchase price value (quantity * purchase prices) based on the purchase price given to each variant. The last column is the gross retail price registered when retrieving each order..
I hope this article gave you a good insight about how data reports work. If you have any questions, please contact us via chat, email or phone. We are here to help!
Stock adjustments report
The stock adjustments report is an overview of all stock level movements with the reason for the adjustment, within a given date range.
This report has eight columns with the names product, id, sku, previous_qty, new_qty, movement, reason, date_time.
The first column is the product name, the second the product id, in most cases the EAN barcode. The third column is the SKU (stock keeping unit). Next we have the previous_qty. This is the quantity before the movement happened. The next one is the new_quantity. So the quantity after the movement. Next we have the movement value. This is the quantity in which the stock level has increased or decreased. Next we have the reason of the stock level movement and the last column is the date_time, when the stock adjustment happened.
Low in stock report
The low in stock report is an overview of the items where the available quantity is lower then or equal to the threshold quantity.
This report type has five column, with the names: product, id, sku, quantity, threshold.
The first column is the product name. The second column the product id, in most cases the EAN barcode. The third column is the sku (stock keeping unit). Next we have the quantity, which is the available quantity and the last column is the threshold value. This value is updated everyday, based on the weeks selected per item. For more information about the threshold, read this article.
I hope this article gave you a good insight about how data reports work. If you have any questions, please contact us via chat, email or phone. We are here to help!