Inventory health reports
 Updated
In this article we will show you how to retrieve Inventory health reports from your Stockpilot account.
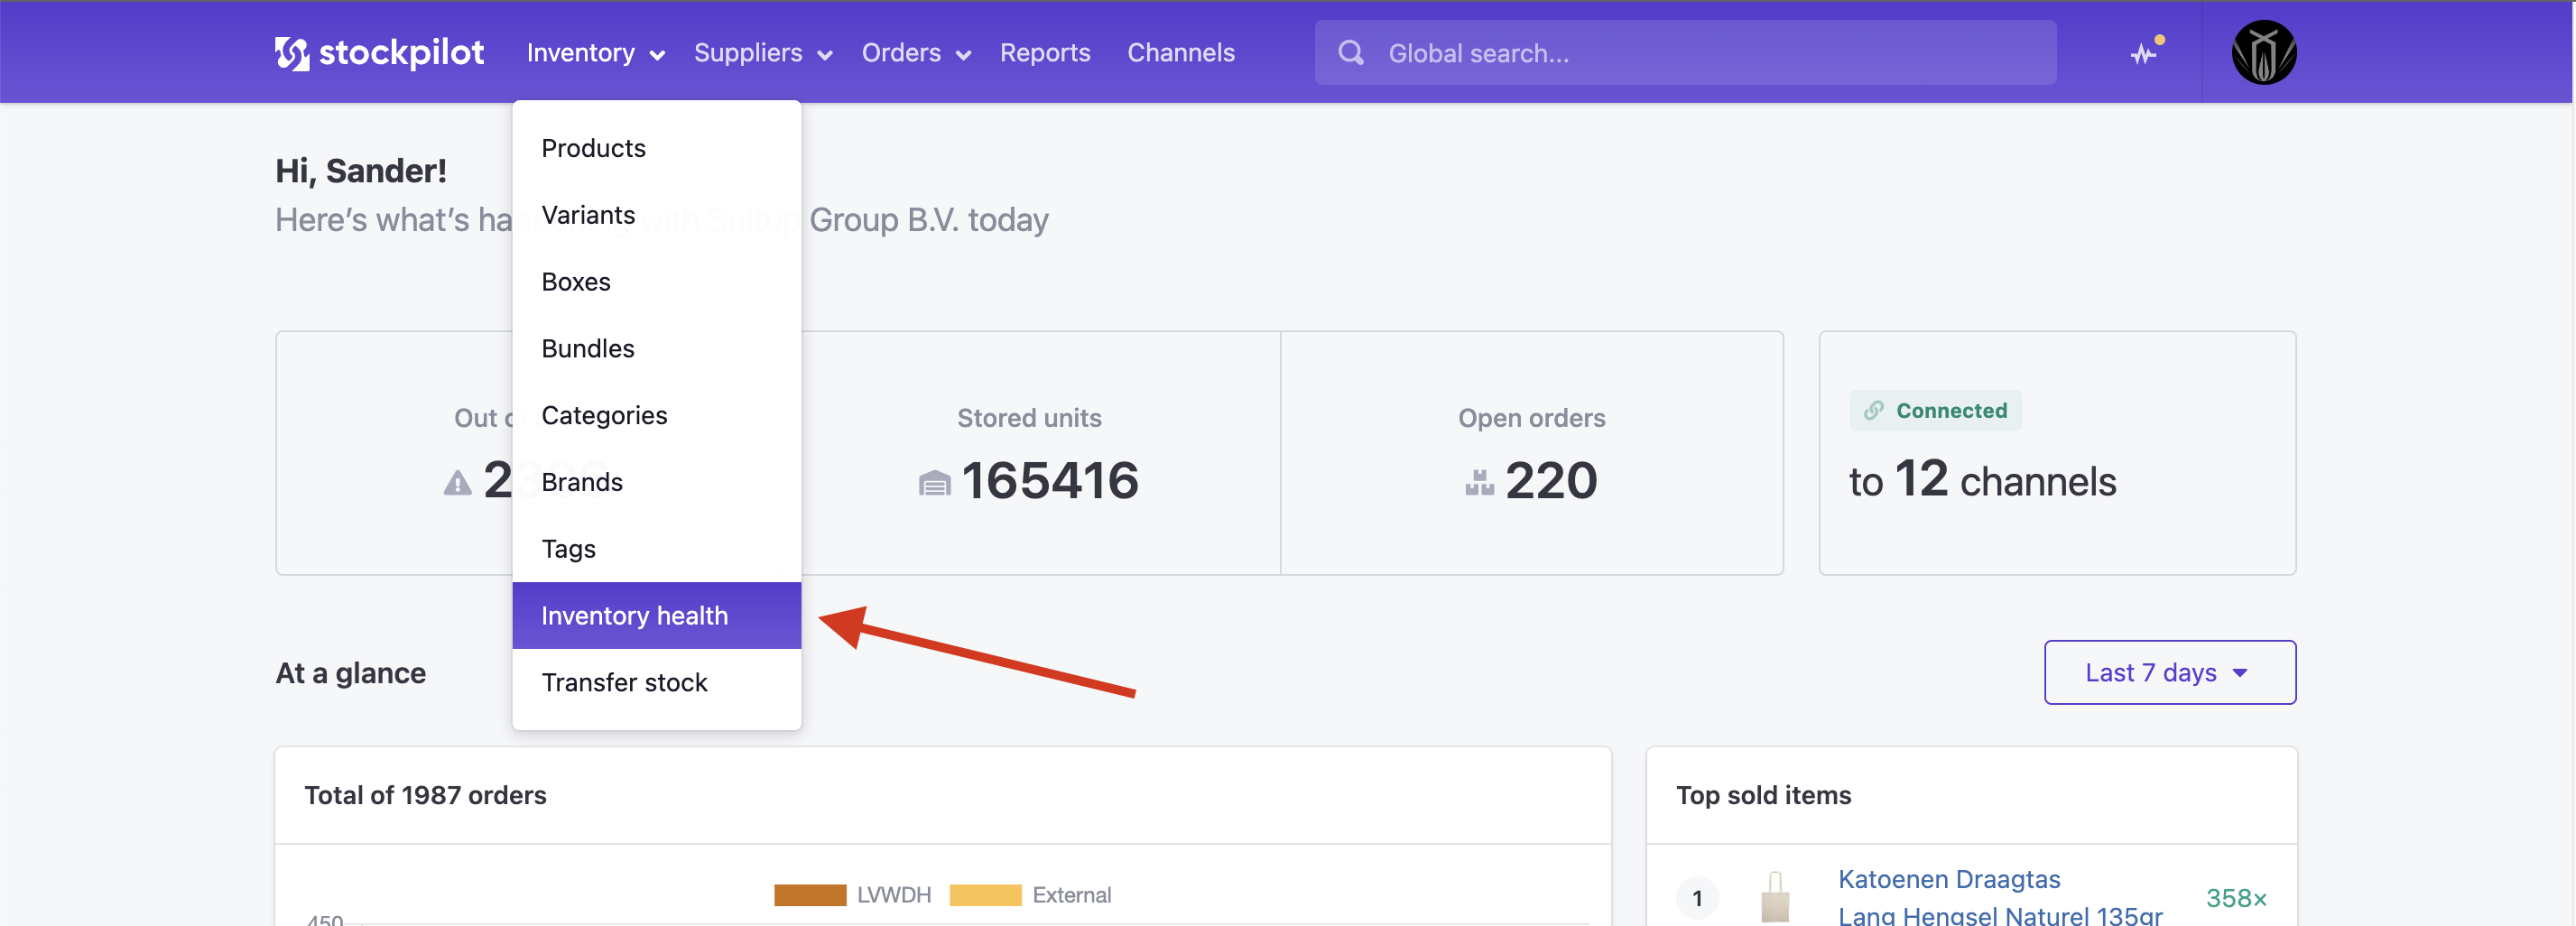
First navigate to Inventory in the top menubar and in the dropdown click Inventory health.
We are now on the inventory health page. You will see a table with a few columns that we will explain below. It's important to know that the information shown on this page is based on past sales data.
To retrieve the right sales data, it is essential to connect all the listings from your sales channels to your Stockpilot inventory. If you did not connect any of your listings yet, let's first do that, else the health table will show no results! How and why to connect listings is explained in this section of the knowledge base.
The inventory health page
Let's go step by step through what we see on the inventory health page.
On the top right you'll find a Filter button. If you click this, you can select the categories you want to see and click Apply to submit the ones you've selected.
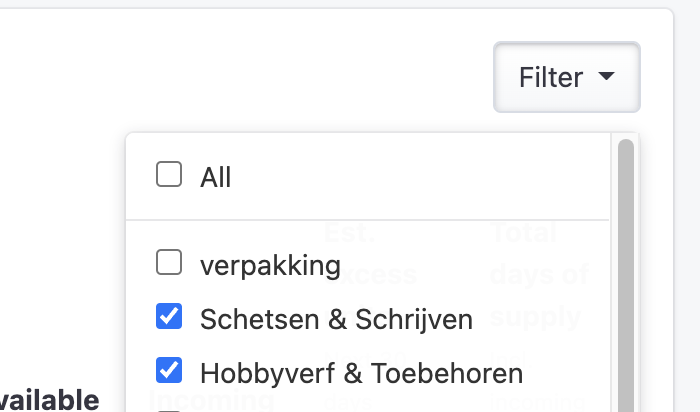
The table will refresh with the inventory related to the selected categories. Now let's see what we're exactly looking at.
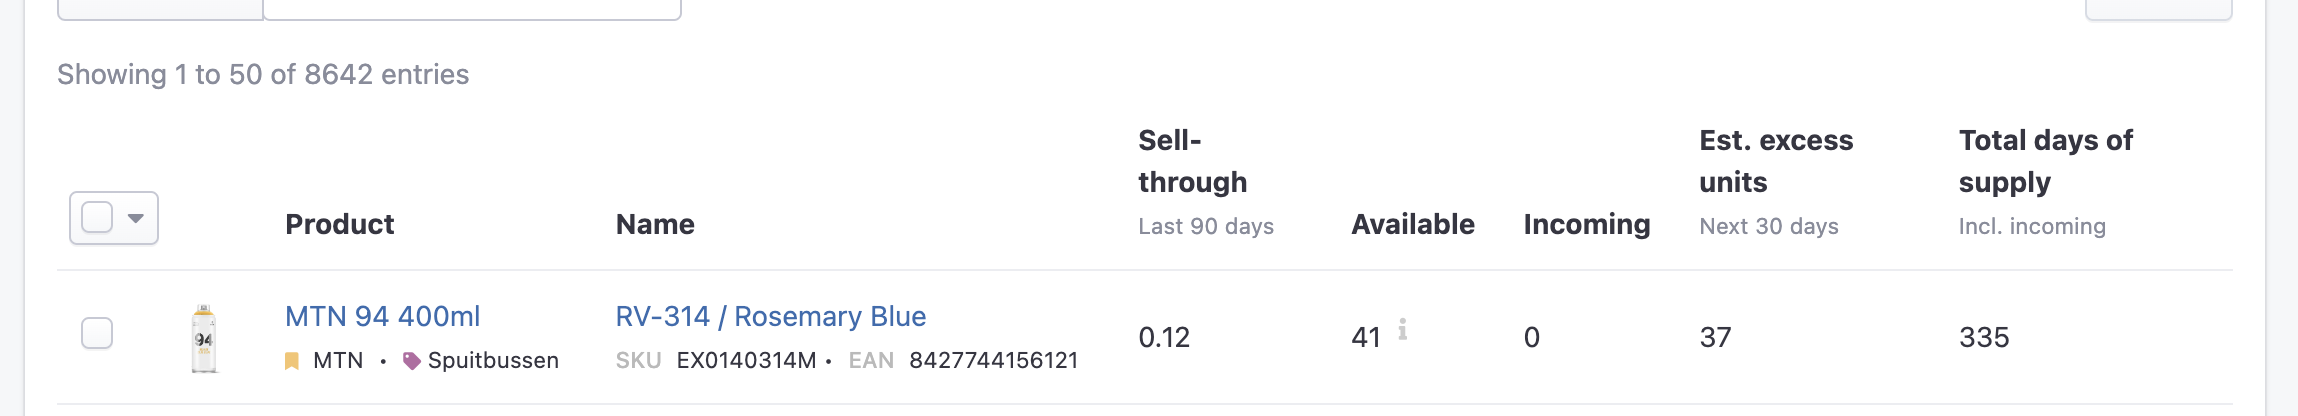
The first two columns are clearly the product name and details. From the third column onward it get's more interesting.
First we have Sell-through this is the average units sold per day, based on the past 90 days of sales data.
Next we have Available and the Incoming units. Available is the current stock level and incoming what is inbound from purchase orders.
The sixth column is name Estimated excess units this one tells you how many overstock you have for this particular item.
The last column is Total days of supply this value tells you how many days it will take you, before you are out of stock, based on the current sales data.
This gives you a pretty good view on how your inventory is doing. In the above example, a sale discount could not hurt the business!
Generate the inventory health report
There is one more button that I want to go over with you. It's named Export.
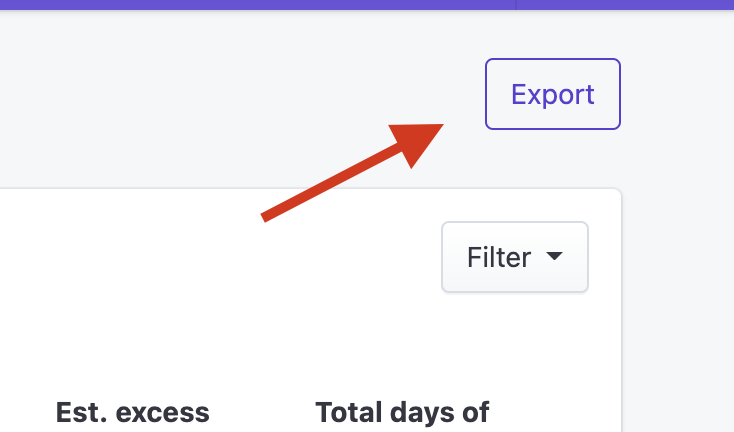
Once you click this button, a report will be generated, which you can download shortly.
When you click the same button, that now says Download, a CSV file will be downloaded. Now you will see the same columns as on the page, with an extra field which is the purchase price.

Now you can make all the excel calculations you want. For example how much percentage of the total inventory value are all excess units?
I hope you feel empowered to keep you inventory healthy as possible with this report!
If you still need help or have a question, please contact us by chat, phone or email!